Data is beautiful – pt. 3

Numbers can say a lot about things, but they can equally be very abstract. Having something to look at can be very helpful in understanding relationships between data points and quantifying the significance. In most cases a quick trip to your favorite spreadsheet editor can help with that, but there are also ways to extract and visualize data in other ways. The methods are about as plentiful and colorful as you can imagine the data will be, so without going into specifics on which tool to use we can take a more general approach to what might be of interest. Selecting the right tool for data extraction and visualization depend on a lot of factors, so it makes little sense to provide any syntax as example, when, due to the nature of the data itself, the approaches different tools might take can be vastly different.

This is even more true for the data contained in things outside of databases and other storage systems. Extracting data from more dynamic sources is a completely different task in data processing, which can require different tools and a much broader approach to interpreting the results. Diving into realms that deal directly with data provided by other software and the resulting uncertainty of both accuracy and validity can mean downright manual review.


Visual data


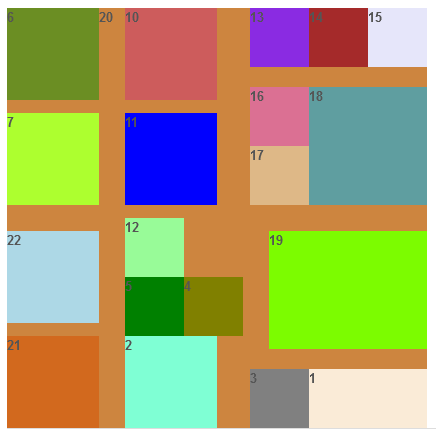
A bit of a different matter is the data used to create the actual visuals you can see. Most of that can be easily viewed easily and without the need to convert anything. This is less the case for the information that generates parcels. The data required to define the outline of them is setup as a bitmap, which is a short way of saying a large grid of numbers, which simply defines each part that belongs to a particular parcel. Sounds easy enough to understand and it is from the perspective of a computer, but in order to convert that into something visual for a human brain requires a bit more. It is complicated by the fact, that the data contained in the bitmap is stored in a format not easily readable as actual bits of 1 or 0. Instead the data, as any data is on modern computers, is put together in bytes, which first have to be broken up into their 8 parts to return the bits we need.

Once the data is available as simply a grid of numbers the fun part begins. Each entry in the table constitutes a single parcel, so multiple entries each form the lines between those parcels. In order to visualize this by way of showing a parcel as a differently colored area on the square making up a region, the various entries have to be combined back into a data structure that represents an assigned of a parcel identity to each occupied spot. Effectively replacing the grid of 1’s and 0’s with the id of the parcel. With that part complete the hard work is out of the way and what is left is simply presenting the resulting data structure visually, which can be accomplished in more ways than there are grains of sand.

As an example it can then be shown in this form:

Additional information can be gathered through other tables within the region context to show things like the teleportation target or specific data about the parcel itself. Even the rough locations of objects and their size can be visualized. There really only exists one limiting factor and that is data processing requirements and thus speed. Transforming data from its numerical representation inside the database to visual objects can be quite resource intensive depending on where the processing occurs. There are tradeoffs in sending data for processing by whatever is viewing it, to processing it at the server end and providing only the object data necessary for the visuals.

In a similar fashion the terrain tables contains information about the heightmap used to generate the visual terrain on a region. It, too, is stored in a format that isn’t easily readable. In difference to the parcel information, the data structure here contains not simply 1’s and 0’s, but floating point numbers. It makes sense in that the terrain heightmap requires a lot more granular information than can be represented with even whole numbers. While a grid of complex numbers at first does not sound much more complicated to decode than whole numbers, what compounds the difficulty is that these numbers are stored in a specific bit format in order to provide more digits after the comma. Commonly with image files, which is what ultimately heightmaps are, this is denoted by the bit depth and can range from 16 all the way to 32 bits in most cases. Consequently a completely different approach is required to turn those bits back into humanly readable numbers or a visual representation that is easily viewed and understood.

Fortunately in regards to visualizing this, the routines required for converting such a bitmap to an actual image are a dime a dozen and most programming languages provide tools for this. It becomes more a manner of working out which one provides the faster conversion as image processing speed heavily depends on what hardware ultimately does the conversion. This is because when it comes to floating point numbers there is one part found commonly in most computers that is leaps and bounds better and wrangling those than anything else. A graphics card, which as the name suggests is rather well suited to dealing with images and graphics. So an easy choice, so long as it is actually available, which is not the case when it comes to the hardware configurations found for applications that are meant to provide something to hundreds of people. Beyond the availability itself, the interfacing with the hardware can be quite tricky and even though software exists to ease the burden, it often requires to interface with something that isn’t easily adjustable should the hardware change. This leaves the processing to the main processor, which fortunately is still no slowpoke when it comes to required transformation of data.

OpenSimulator ultimately provides access to this data in a visual form through the utilities in the terrain section. They can be used to turn the data into images, which given the right software, can be viewed and manipulated. This also means, the required code is already readily available through the source code itself. Thus anyone that wishes to create a visualization has a direct point of reference on how to accomplish this. Granted it still requires some changes or a translation into a different programming language, but it is certainly easier to read compared to programming code used to visualize the parcel information in whichever viewer is used.

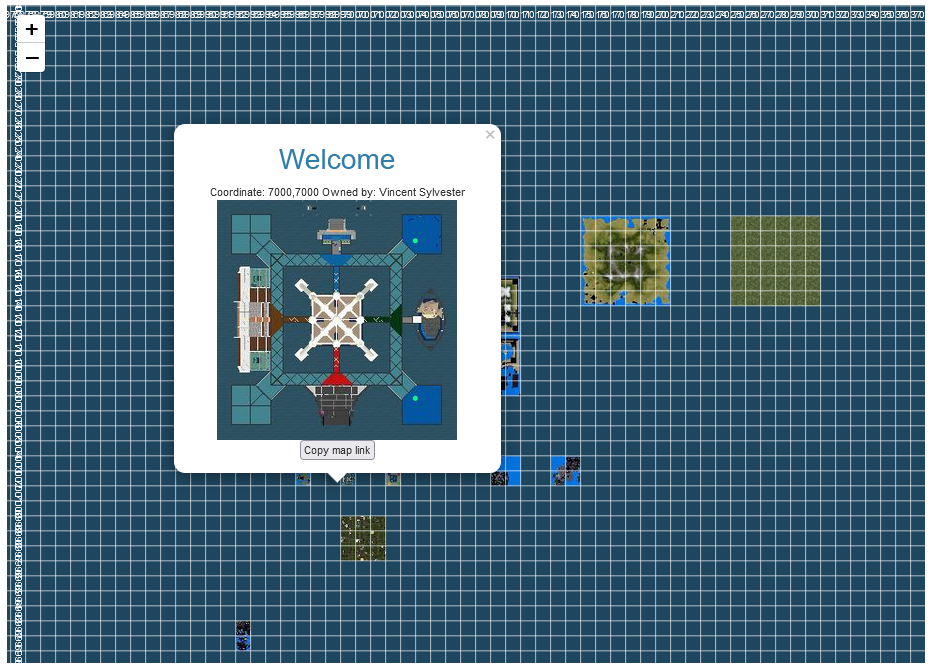
On the higher grid level the visual data is much less impressive, but nonetheless interesting. Beyond the usual suspects of user profiles and the data making up the search functionality, we can also visualize the world map. The code responsible for showing the world map in a viewer requires a data structure that appears to be quite conducive to visualization, but the devil is in the detail. Much like most maps, it would not make sense to show it as one large picture, because this would take up a lot of resources. Instead the map is split up into tiles, that can be individually retrieved only when necessary. This is normally a solved problem still, but unlike the maps of our own planet the way each tile is arranged follows a different path. This means that any software normally designed to handle earthen maps will arrange the tiles in a manner that changes their orientation. This is because the coordinate system used extends from a different origin point and moves across the screen in a different direction.

Changing the way a coordinate system is interpreted and either building the map based on it or transforming the coordinates back to the standard is easier said than done. As this is likely not the first time this type of problem has come up, depending on the source of the map tiles, most software designed to provide general maps of anything will have some way to make the changes needed for this. Though this still means significantly more work is involved than just simply pointing the software at the tiles and enjoying a lovely map in front of your eyes. With this part completed, however, there is not much else left beyond adjusting the way in which different scales are handled to provide the all important zoom functionality. Similarly to parcels we can reference other information in the database to add more information, such as the names of visible regions and even who owns them or how many avatars are currently using them. A complete analog to the viewer world map is possible through utilizing the data providers of each region and the information contained in various other tables. Although this sort of data processing is likely to require a lot of consideration in regards to frequency of refresh or caching mechanisms, especially if there are a lot of regions to process.

A good example of the possibilities with relatively simple processing can be seen on our in-house grid ZetaWorlds through the world map provided there: https://zetaworlds.com/map


Hidden data


Might not be the best description for the information contained in log files. OpenSimulator does not store historical information in the database, otherwise it would easily exceed the storage capacity of most installations. Information about what was can only be retrieved through the log files or strategic logging of information in the tables to other tables. As mentioned above in the technical section this can be quite useful for analyzing trends or detect the causes of issues that arose over time.

Specifically in regards to log files there are two main points of information. The region log files mostly containing information about critical actions performed on a given region as well as those that are responsible for them. On the other side the logs generated by the grid side provide a broader overview, but nonetheless critical information when it comes to issues.

Parsing this data into a usable format can be difficult depending on what tools are available for this. A task made more complex due to variation in the data as there are parts directly controlled by a user, so possess the potential to be almost anything. Searching for keywords and patterns or directly turning the whole thing into data stored in an actual database are valid options and depend on what sort of goal the data retention is supposed to provide. In most cases the mentioned searching through the logs is likely to be enough, but storing critical pieces of information in a database can be both simpler and faster to search through as well. So in the end this strongly depends on both the use case and the simple volume of data generated.

OpenSimulator, for the most part at least, does utilize standard logging techniques that should provide ways to interface with the generated logs. Through the use of those standard libraries the logging can also be changed to provide additional information or reduce the logged data for easier and faster searching. Most of the available changes to the logging setup are documented within the documentation available for the log4net library most of the logging depends on. Beyond this there are specific additions to this added to handle certain requirements OpenSimulator had in terms of logging that are not covered directly by log4net. Unfortunately documentation for those additions is lacking, which means most of the information regarding its operation and capabilities can only be obtained through reading through the relevant source code.

This about covers the most interesting parts of the data within OpenSimulator and how to extract some of it. There are a lot more things that can be interesting to look at depending on your use case and not all interesting data might be logged or readily available either. Fortunately either through existing extensions or by changing the code directly almost everything can be retrieved, logged and processed for visualization.

Data is beautiful – pt. 2

Continuing on from the dry statistical analysis to another fairly coarse subject matter. As statistics provide numbers, those numbers do actually mean something. This is especially true when considering that all of the metrics signifying growth carry the consequence of increased physical data on hardware and the potential to be a much bigger headache than anticipated. To avoid headaches regular maintenance is key, but beyond the obvious there is a lot more going on under the hood than might be expected. In technical terms, there are some numbers and data to look at, which provide an insight into what is going on within an installation and also what potential issues are being created.

There is a lot of information to look at, but the most prone to issue metrics are actually not that complicated to understand. It is still a fairly technical, and thus dry, topic to work through, but all the more important. Leaving everything to software to handle itself is not a good idea when you cannot be sure the appropriate routines to manage all data points exist within it. As to why they may not exist, given the complexity of the data and the an equal lack of information as to why it might come into existence, there can never be a routine that accurately guesses an adequate action. Operating on assumptions often enough leads to trouble, but it can be even more detrimental in regards to software. Knowing what to look for and understanding the capabilities of software or lack thereof is rather important when it comes to long-term stability in the face of continued growth.


Technical data


Outside of the statistical information regarding the usage and scale of an installation there also exists data worth looking into from time to time. Primarily to further judge both the scale of an installation and the types of data it consists of. The biggest such provider of data is the asset server itself, as it comprises the single largest source of information for most installations.

Assets are categorized by type, which offers an insight into what sort of content is mostly present and can also give an indication of what growth to expect and thusly what requirements the installation will have to the hardware it sits on. In some cases the distribution of asset types can also provide a warning about problematic sources of content. This is especially interesting in the case of Notecards being created automatically by scripts in manners that create unnecessary data.

A simple count of the type can already provide this indication, as usually the distribution of asset types should lean towards textures, objects and scripts. Though this would also count Notecards generated by users rather than scripts and we specifically want to know, beyond just the number, where the source of them could be, which requires more information. The simplest way, then, is to look at the amount that share the same name as the source is likely to be one or multiple script(s) creating them.

SELECT `name`, COUNT(*) FROM assets WHERE description='Script generated notecard' GROUP BY `name` ORDER BY COUNT(*) DESC;

Generating a ranking of sorts to show the biggest offenders first. If not from the name itself, then the contents of any Notecard by that name can usually provide insights into their origin. It goes without saying that catching such things early is usually best, but that does not mean damage done should or needs to be ignored. While it is very difficult to determine the in-use state of a given Notecard, in cases of hundreds or even hundreds of thousands of them, action is still required. Resolving the source of the problem first and thus reducing the potential for further spam should be the first step. Then, once a mitigation has been made the data no longer required should be removed. This can mean simply deleting the entries from the database, but might require also removing the corresponding data from the filesystem. With most asset servers the filesystem contains a structure of folders and files that can be recursively searched via the hash stored in the database. Entries removed from the database can thus be used to look up the corresponding files. Similarly the opposite can be achieved through crawling the filesystem and attempting to find a corresponding entry in the database. With none present the file serves no purpose and can be safely removed.

SELECT sha256 FROM assets WHERE sha256='$filename' LIMIT 0,1;

As an example from PHPSAS. Crawling larger filesystems can be quite slow as the nesting and number of folders can reach into the tens of thousands. It also stresses the IO capacity of the hardware so it is advisable to add delays to the routines or only perform this task during times with low utilization.

In terms of other data with technical impact, mostly to performance, but in extreme cases to stability, are frienships. This may sound strange, but the internal routines to manage the information regarding friends requires OpenSimulator to renew information about each of them whenever a user changes their location within a grid. As this information doesn’t carry much data each query is usually dealt with relatively quickly. A problem, however, arises when this information cannot be sent to a designated endpoint. Eventually a target not responding to the request will result in a timeout, but during the waiting period for a response the request holds up a spot in the queue. Enough of those in a row and the queue is full, with no more data, friend or otherwise, getting through. In extreme cases this can cause a region to become unresponsive.

In order to reduce this problem it is usually a good idea to try and keep the number of friendships in a manageable area, but that is easier said than done for some social butterfly. On the other end we can go through the frienship information and determine a ranking of who happens to have gotten around the most and thus pose a potential for having either too many or potentially problematic frienships associated with them.

SELECT UserAccounts.FirstName,UserAccounts.LastName,Friends.PrincipalID, COUNT(*) AS Friendnum FROM Friends JOIN UserAccounts ON (Friends.PrincipalID=UserAccounts.PrincipalID) GROUP BY PrincipalID ORDER BY Friendnum DESC;

A total count of friends is one with, but removing those entries that point to a dead endpoint is a different matter. Users are unable to remove friendships that cannot reliably inform the other end of their dismissal. This means, that once an endpoint is dead, the friendship cannot be removed by the user. It requires removal directly through the database as well as removing the Calling Card item associated with the friendship. Determining whether and endpoint is temporarily unavailable or completely dead remains to be evaluated on a case-by-case basis.

Above a mention is made about the known grids information contained in the GridUser table. There simply a count is made of how many unique entries are present. We can also extract their urls from the same table. The remote users are entered via their UUI, which is a combination of their UUID, name and origin grid address. By removing the parts we do not need from the UUI we can create a list of just the origin urls.

SELECT DISTINCT(SUBSTRING(UserID,(LOCATE(';',UserID,1))+1, (LOCATE(';',UserID,(LOCATE(';',UserID,1)+1)) - (LOCATE(';',UserID,2)-1)-2 ))) FROM (
SELECT UserID from GridUser WHERE UserID LIKE "%;%;%") as users;

Removing the parts of the UUI by the ; delimiter and returning the distinct result we get a list of just the urls. Between MySQL and MariaDB the syntax to accomplish this can be a bit different as the methods for locating substrings and returning parts of strings differ.

For administrative purposes or in the case of a popularity contest it may be beneficial to know the locations of users. While it is not possible to get their exact coordinates through the database, we can determine the specific region they are currently connected to. However, as avatars can also be visiting from remote grids we cannot simply correlate the Presence information with the UserAccounts data alone. Instead the GridUser table needs to also be checked for matching entries and subsequent returned matches be altered to return the same usable data.

SELECT CONCAT_WS(' ', REPLACE(SUBSTRING(GridUser.UserID,(LOCATE(';',GridUser.UserID,1)+1)),';',' @ '), UserAccounts.FirstName, UserAccounts.LastName) AS Avatar, regionName
FROM Presence
LEFT JOIN regions ON Presence.RegionID = regions.uuid
LEFT JOIN GridUser ON GridUser.UserID LIKE CONCAT(Presence.UserID, ';%;%')
LEFT JOIN UserAccounts ON UserAccounts.PrincipalID = Presence.UserID;

Similarly to the query above there may be differences in syntax between database software, but the method remains the same. We look at both the UserAccounts table for the avatar names as well as parsing the UUI’s contained in GridUser table to create usable names. Then we can simply match the Presence information to the matching entries in both tables and add the region names to them. Further to note is the type of join performed to only match the actually present information when matches are found in the relevant tables as GridUser does also contain information about local users matched by their UUID.

Much like friendships, large groups can cause performance issues as well. Primarily through the functions that send information to all users within a group. This can also cause regions to become unresponsive for the time it takes to complete all the resulting scheduled sending of information. As with friendships, we mostly just want a ranking of the largest groups in order to take action on them first.

SELECT os_groups_groups.`Name`, (count(*)) as Members from os_groups_membership INNER JOIN os_groups_groups ON os_groups_groups.GroupID=os_groups_membership.GroupID GROUP BY os_groups_membership.GroupID ORDER BY Members DESC;

As is probably easy to guess by now the behavior of external users within those groups is similarly problematic when it comes to removing them. Without the endpoint replying to the request the removal is not possibly to be done by the groups founder and this action must also be performed via the database. Fortunately there is no Calling Card to remove, so no changes to inventory are required.

Not all of these queries are equally important and must be constantly checked. Trend data can be collected and usually acted upon just as much as hard limits, but the idea of offering an unrestricted space for users is also very appealing. Outside of extreme cases it usually takes quite some time before problems arise, but this should not mean there are not outliers either. As usage increases it is a good idea to reduce the intervals between checking the various statistics and technical information. What returned data is reasonable or within soft limits depends on more factors and is different for each installation. When numbers differ from all others by magnitudes it is usually a good indicator for potential problems. Eventually symptoms arise, but with the knowledge of their potential causes and a quick check of the information the cause can be narrowed down. This goes both ways as well, when the statistical or technical information shows a reasonable or even small utilization then the cause of a problem isn’t found in the simple overburdening of the installation.

To clear up any potential concerns, the information and relations made through these queries are all part of process-relevant information and their usage in regards to statistics and maintenance does not constitute any data-processing that would be subject to requirements for processing consent. Of course, the data itself is still specific to all the individuals that have created it, but none of the queries return data that can be attributed directly to an individual. In case of your own protections remember that anyone with access to the database can view and even manipulate all of your data, which is not just the case for OpenSimulator.

Data is beautiful – pt. 1

A fairly common expression not just among the stat majors and math nerds on the internet. On its own such a statement always requires a qualifier though, as with anything that describes the world around us, what data we see doesn’t necessarily provide any further information about what we can observe with our own eyes. It’s the things it cannot show and thus require interpretation that is the most interesting part about statistics. Philosophies aside, statistics are important for various reasons, if only to have some form of overview of what you are dealing with.

With OpenSimulator there exists a lot of information inside the underlying database structure, but a lot of that is either hidden in other information or requires correlation to multiple points of data to return any useful information. Plain statistics and system information used to gauge the health of the installation and the scale at which it operates at are somewhat difficult to grasp, if the concepts of how the database operates and the data within correlates to each other are not well understood. Unfortunately not much of this is documented either, but how about we fix that part?


Statistical data


Starting with the most common data points of interest to grid owners, the usage statistics of the platform they run. Users, their origin and connections as well as the information that is extrapolated from them.

A big metric for many is the activity on their grid, which is often seen as the most important indicator of success or validity of their egomania. Unfortunately the information available to accurately determine this figure is somewhat limited due to the lack of information being stored within the database. We can more accurately determine the number of active users on a grid through the information the users provide beyond just their name, but this data is only available through the logs. Without much trouble changes can be made to store this into the database and thus provide additional means to increase the accuracy of this particular statistic, but we won’t go that far in this article.

Another, seemingly, useful metric to determine usage is the scale of the installation, which usually is measured in the amount of space it makes available to its users. Unfortunately the information, again, lacks depth to gauge if any of that space is actually usable in the sense that it is open to the public, but this is neither a clear case anyways, nor is there a direct way to determine this without significant changes to information kept in the database.

External connections, made both inbound and outbound, in the form of any information shared within the metaverse is another very useful metric to get an idea of the level of integration a community might have to the wider metaverse. Factors in this are a good indicator on whether there is an active exchange happening between communities and how much your own community interacts with others.

Among all of this information sits a myriad of other statistical data. Some of which is useful for pursuing certain goals or simply to track and watch evolve over time. The big question, that is often somewhat vaguely answered and poorly documented, then is how to extract all this information. There are a multitude of ways to accomplish this, but in order to both look at the information at a glance and more easily retain it over time as historical record and trend information the best way remains to directly query the database for it.

With a single, albeit rather complex, query most of the relevant information can be extracted. Through the use of correlation and filtering it can be enhanced to be more accurate and provide data points not directly tracked. While simpler ways exist to fetch this data, they, unfortunately, also gloss over the options to remove erroneous or duplicate data, so the only way to actually achieve some form of useful and accurate data is to take into account all available data points and correlate them accordingly.

To start, let’s look at the data points we can actually retrieve from the database and what they stand for:

  • online_users – As the name suggest, the currently online users that are actually inworld somewhere, which is determined by being on a valid region
  • active_local_users – The amount of users that have logged into the grid at some point in the last 30 days, which can be qualified by removing duplicates
  • active_visitors – Those that have visited in the last 30 days, which unfortunately cannot easily be deduplicated
  • traffic – A combination of all the locally active and external visitors from above, which is what most refer to as activity
  • total_visitors – How many unique users have visited from external sources, again hard to deduplicate
  • residents – Counting how many have registered an avatar that is not an alternate of an existing avatar.
  • recent_registrations – The count of how many registrations happened in the last 30 days
  • region_count – Just the total number of rows seen in the database
  • region_equivalent – Determining the size of var regions to how many normal region spots they occupy
  • land_area_sqkm – And then taking that to work out how much space that is in square kilometers
  • friendships – We can work out who is friends with who and count only those true friends
  • hg_friendships – Similarly for external users, with the caveat that this is sometimes a bit bugged
  • partnerships – The ones really close to each other
  • groups – Counting all the local and externally known groups
  • known_grids – Extrapolated from the visitors we can determine how many unique other grids have visited

Now to determine each of these data points we can run specific queries to the database to return them.

online_users
SELECT COUNT(*) AS online_users FROM Presence WHERE RegionID != '00000000-0000-0000-0000-000000000000'
Selecting the count from the Presence table, but excluding any entry that shows the RegionID as a null key, because this usually indicates a user has crashed due to a failed teleport or otherwise. Incidentally the “you are already logged” message is caused partly by this information as well, so we should exclude it and ideally even remove any such entries in the table if they remain there for more than a few minutes.

active_local_users
SELECT COUNT(DISTINCT(UserAccounts.Email)) AS active_local_users FROM GridUser INNER JOIN UserAccounts ON GridUser.UserID=UserAccounts.PrincipalID WHERE GridUser.Login > (UNIX_TIMESTAMP() - (30*86400)) AND (GridUser.Logout - GridUser.Login) > 30
In order to count just the unique active users we can match their GridUser entries, which contains the information about their last login time, to the UserAccounts table, which contains the email address associated with the specific avatar. While this isn’t a complete indication of a duplicate, it does provide at least some hints. We can further remove any entries that show the time actually spent inworld to be less than 30 seconds, arguably an amount of time that allows for very little actual activity. Through matching the UUID across the two tables we actively remove the external visitors as they are denoted with their full UUI instead, so no matches and joins are performed for them.

active_visitors
SELECT COUNT(*) AS active_visitors FROM GridUser WHERE UserID LIKE '%http%' AND Logout > (UNIX_TIMESTAMP() - (30*86400))
Then in order to fetch the external visitors for the last 30 days we can filter by looking for entries that contain a UUI and check the timings for those. Using the time of log out to make sure we only look at those that successfully reached our end and logged out properly. Login time may be set even if a visitor never actually reaches our end, so it is not a reliable specifier for the metric we are aiming to extract.

traffic
(active_local_users + active_visitors) AS traffic
Simply combining the locally active users and the visitors then we can determine the overall traffic or active user count.

total_visitors
SELECT COUNT(*) AS total_visitors FROM GridUser WHERE Login > 0 AND UserID LIKE '%http%'
In difference to the activity counts simply filtering by UUI and a login time greater than zero we can see the overall number of avatars that have visited since the creation of the table. Unfortunately without storing more data it is very difficult to deduplicate these entries.

residents
SELECT COUNT(DISTINCT(Email)) AS residents FROM UserAccounts WHERE UserLevel > 0
Similarly to the active users we can remove some duplicates via the email address and obviously we need not count users that have been banned.

recent_registrations
SELECT COUNT(DISTINCT(Email)) AS recent_registrations FROM UserAccounts WHERE Created > (UNIX_TIMESTAMP() - (30*86400))
Removing the duplicates through the email address again and utilizing the timestamp of the account creation to determine the amount of newly registered users in the last 30 days.

region_count
SELECT COUNT(*) AS region_count FROM regions
A simple count of the regions listed in the table.

region_equivalent
SELECT SUM(POWER(sizeX/256, 2)) AS region_equivalent FROM regions
In order to get the actual scale of the world we can look at the reported size of a region and divide it by the standard size. Then square it to get the amount, which we only have to add up.

land_area_sqkm
SELECT (SUM(POWER(sizeX, 2)))/1000000 AS land_area_sqkm FROM regions
Using a similar method we can fetch the total size in square meters occupied by a region, which we then only have to convert to square kilometers by dividing the sum by 1.000.000

friendships
SELECT CAST(COUNT(*) / 2 AS INT) AS friendships FROM Friends Friendship JOIN Friends Friended ON Friendship.PrincipalID = Friended.Friend AND Friendship.Friend = Friended.PrincipalID
In order to count a friendship only as one friendship between two users we obviously have to divide the whole number of them found in the Friends table. This often results in an uneven number though, which can usually be resolved with two methods shown here. Casting the result as an integer forces the number to be a whole number without a comma. The other method is joining the Friends table back into itself in order to check if a friendship actually exists from both perspectives, meaning both parties have accepted the friendship and the corresponding mirrored entries exist in the table, which removes friend requests that have been ignored.

hg_friendships
SELECT CAST(COUNT(*) / 2 AS INT) AS hg_friendships FROM Friends Friendship JOIN Friends Friended ON Friendship.PrincipalID = Friended.Friend AND Friendship.Friend = Friended.PrincipalID WHERE Friendship.PrincipalID LIKE '%http%' OR Friended.PrincipalID LIKE '%http%'
The same can be applied specifically to friendships that connect users across grids. Though it should be noted that in some cases these entries are not properly set on both ends and thus this number is likely not as accurate as it may seem. Much like the GridUser table we can specifically check for the UUI to exclude local users from this number.

partnerships
SELECT COUNT(*) AS partnerships FROM userprofile WHERE useruuid IN (SELECT profilePartner FROM userprofile) AND profilePartner!='00000000-0000-0000-0000-000000000000'
These are similar to friendships in that they can technically exist only on one side, so checking whether both sides have mirrored entries makes sense. OpenSimulator does not internally handle partnering.

groups
SELECT COUNT(*) AS groups FROM os_groups_groups WHERE Location=''
Looking only at the local groups through the filter of excluding any entries that contain a location pointer to the origin grid.

known_grids
SELECT COUNT(DISTINCT SUBSTRING_INDEX(SUBSTRING_INDEX(UserID, ';', 2), ';', -1)) AS known_grids FROM GridUser WHERE UserID LIKE '%http%'
AND UserID NOT RLIKE 'http\:\/\/[0-9]{1,3}\.[0-9]{1,3}\.[0-9]{1,3}\.[0-9]{1,3}'

We can count the number of unique grids that have been utilized by external users to visit our local installation by checking the GridUser table for all the UUI’s contained within. This should be filtered to remove entries that simply include the remote grid address as a direct IP address as the validity, accessibility or existence of installations that use them is questionable at best. This can be accomplished most easily with regex, which, despite being rather slow to execute, is still easiest. Further filtering for accessibility of existence cannot be done with SQL directly and we also cannot determine if an entry is simply a renamed existing one either.

Finally we can combine all these individual queries to provide a single row of statistics, which can be used as a single query to write the results into another table for historical information; or simply to output everything in one go and show the results. To do this each query needs to be turned into a subquery and given a temporary object to write the data to.

SELECT
online_users, active_local_users, active_visitors, (active_local_users + active_visitors) AS traffic, total_visitors, residents, recent_registrations, region_count, region_equivalent, land_area_sqkm, friendships, hg_friendships, partnerships, groups, known_grids
FROM
(SELECT COUNT(*) AS online_users FROM Presence WHERE RegionID != '00000000-0000-0000-0000-000000000000') AS stats1,
(SELECT COUNT(DISTINCT(UserAccounts.Email)) AS active_local_users FROM GridUser INNER JOIN UserAccounts ON GridUser.UserID=UserAccounts.PrincipalID WHERE GridUser.Login > (UNIX_TIMESTAMP() - (30*86400)) AND (GridUser.Logout - GridUser.Login) > 30) AS stats2,
(SELECT COUNT(*) AS active_visitors FROM GridUser WHERE UserID LIKE '%http%' AND Logout > (UNIX_TIMESTAMP() - (30*86400))) AS stats3,
(SELECT COUNT(*) AS total_visitors FROM GridUser WHERE Login > 0 AND UserID LIKE '%http%') AS stats4,
(SELECT COUNT(DISTINCT(Email)) AS residents FROM UserAccounts WHERE UserLevel > 0) AS stats5,
(SELECT COUNT(DISTINCT(Email)) AS recent_registrations FROM UserAccounts WHERE Created > (UNIX_TIMESTAMP() - (30*86400))) AS stats6,
(SELECT COUNT(*) AS region_count FROM regions) AS stats7,
(SELECT SUM(POWER(sizeX/256, 2)) AS region_equivalent FROM regions) AS stats8,
(SELECT (SUM(POWER(sizeX, 2)))/1000000 AS land_area_sqkm FROM regions) AS stats9,
(SELECT CAST(COUNT(*) / 2 AS INT) AS friendships FROM Friends Friendship JOIN Friends Friended ON Friendship.PrincipalID = Friended.Friend AND Friendship.Friend = Friended.PrincipalID) AS stats10,
(SELECT CAST(COUNT(*) / 2 AS INT) AS hg_friendships FROM Friends Friendship JOIN Friends Friended ON Friendship.PrincipalID = Friended.Friend AND Friendship.Friend = Friended.PrincipalID WHERE Friendship.PrincipalID LIKE '%http%' OR Friended.PrincipalID LIKE '%http%') AS stats11,
(SELECT COUNT(*) AS partnerships FROM userprofile WHERE useruuid IN (SELECT profilePartner FROM userprofile) AND profilePartner!='00000000-0000-0000-0000-000000000000') AS stats12,
(SELECT COUNT(*) AS groups FROM os_groups_groups WHERE Location='') AS stats13,
(SELECT COUNT(DISTINCT SUBSTRING_INDEX(SUBSTRING_INDEX(UserID, ';', 2), ';', -1)) AS known_grids FROM GridUser WHERE UserID LIKE '%http%'
AND UserID NOT RLIKE 'http\:\/\/[0-9]{1,3}\.[0-9]{1,3}\.[0-9]{1,3}\.[0-9]{1,3}') AS stats14

Given the inherent complexity and size of this data, beyond just for record keeping and trend analysis, storing it elsewhere in regular intervals means the information need not be queried directly from the various sources. Caching is your friend in this case, but should already be at least partially present on the subqueries that have rarely changing data. Though this does depend on the specific software in use.

It is fairly common to provide this information publicly in order to provide transparency, but undoubtedly also to show growth and ever bigger numbers. What measure of success that ultimately provides is left to the interpretation of each individual reader as none of these metrics can quantify the human condition that makes up the vast majority of the experience we all have with a platform such as OpenSimulator. No one wants to be reduced to numbers, but they are certainly fascinating to look at.

🍂 Becoming greener!

A project started in 2023 to rework the electrical infrastructure in our main office in order to reduce the reliance on grid power and the overall consumption of electricity as well. Our impact on the environment has been the key driving factor here, but it also remains one of the best investments in the future anyone, company or individual, can make these days. Solar is the future! As cheesy as that sounds.

The journey up to a working system has been a bit bumpy, but we are now happy to report, that with the installation now mostly completed, we have observed a 35% reduction of electricity usage from the grid. Producing on average about 15kWh per day from the sun, while keeping our office just that much cooler as well; An added benefit during the warm summer months. The reduction in usage will also reduce our monthly cost overheads by quite a significant amount as our current supply contract scales exponentially with usage. This makes the investment much easier as the projected reduction in costs easily covers the investment within 8 years.

We are continuously looking into new ways to reduce our carbon footprint. As the climate heats up, the heating requirements drop, which allows heat pumps to be more effective. Unfortunately the current situation does not make this a worthwhile investment for us. The installation costs are simply too outrageous and the cost of energy still unreasonably low. It is on our radar, however, as we believe the massive efficiency gains compared to gas or electric heating is worth investing in.

This also means our continuous effort to contribute to the folding@home project is now partially powered by the sun. If that counts as dependant on the tax form? 🙂

Dance for Charity 2023

ZetaWorlds, the Zetamex operated grid, held an event on the 21st of September to celebrate World Peace Day. Encouraging anyone to show to the event to count towards a donation goal and donate to various charities. The event raised over $200 with various contributions of over $90 towards charity. UNICEF received a grid-sponsored donation of $108 for the 36 unique visitors on the event day. We are so thankful for all the support for this event and the staff that made it happen. The money raised will go to a good cause and we encourage everyone to continue donating to the various charities:

https://donate.unicef.org/donate/now

https://giving.unhcr.org/en/ukraine/

https://donatenow.wfp.org/ukraine-appeal/~my-donation

https://www.ohchr.org/en/donation

https://www.amnesty.org/en/donate/


(Original article: https://zetaworlds.com/blog/view/charity-event-2023)

An uncertain, but hopeful future

Following the acquisition of Xamarin by Microsoft the mono project, the runtime supporting many cross-platform C# projects, has been used as basis for further development of Microsoft’s own .NET, which mono had set out to replicate on Linux platforms. In a move that absolutely everyone saw coming, the mono project has been all but shut down, gutted of the most relevant parts and now left with very little support. It has been made clear in many ways mono would not receive a lot of care from the former developers working on it full time. This means barely any updates, releases and a future that looks at .NET(dotnet) becoming the primary runtime for C# projects. While Microsoft has made progress in supporting C# on Linux, they have only taken on the most relevant parts. This results in some features from mono not making the jump and thus breaking existing code. Should projects decide to move to dotnet then they will have to re-engineer these parts using the features still available in dotnet.

What this means for OpenSimulator is clear. The road with mono as base has ended and the only way to secure proper operation in the future will be to move along with Microsoft’s plan to control more aspects of software. This is not a good thing by any means as most already know, Microsoft is not a friend to anything that doesn’t make them money and much less to things that actively drive developers and users into the open-source space. Going along with their usual mode of operation the features not present in dotnet do not have alternatives that can be implemented easily or at all. Thus the parts of OpenSimulator that relied on them are dead in the water unless significant work is done to rebuild them using what is available in dotnet.

The major shift in runtime has also brought along the side-effect of the automated tests used to guarantee at least some form of regression testing, the practice of making sure code changes don’t break existing functionality. A completely new testing system is likely to be the only solution to re-introduce the least of safeguards against catastrophic failure. This is not a task that is easy and it ultimately requires the scarcest of resources, humans. As general practice those writing functions should not be the ones writing tests for them. This is done to make sure the code is examined with a critical view and promote tests written to not simply confirm expected behavior.

Currently the aim to support version 6 of the dotnet runtime as a start is bringing the code standard forward by leaps at, what could be argued, cost of readability of the code itself. Further changes will be needed as well, because newer versions of dotnet are already available. What effect this has on the quality of the codebase as a whole is difficult to quantify. While changes are made to update code and improve certain parts, others are left as-is. May this be due to those parts not benefiting from changes all that much or being complex, abstract or even esoteric in nature that changes require a lot more effort. With such a large codebase uniform upgrades take a lot of time to complete and with very little human resources available is likely to take months to years.

While we remain committed to providing feedback, assistance and code towards the project, it has become rather clear that in order to move forward larger changes are needed. Moving away from the basics of runtime support and changes, there remain some problematic areas in OpenSimulator. These modules and code blocks are in dire need of re-design in order to bring them up to more modern standards or simply to fix the underlying conceptual issues brought about from poor planning or more grand ideas not well translated to code. Unfortunately such large changes to entire modules are never easy and also require a lot of groundwork in order to allow for integration into the project. Famously such large changes required those working on them to create forks and put pressure on the main OpenSimulator project by directly showing the benefits of the changes. This attitude has been brought about through different causes, but remains a concern for those looking to re-engineer larger parts of modules. Equally difficult is ensuring proper operation with the sometimes ancient, by the Internet’s standards, data still floating about across the metaverse. All leading to the barrier for such endeavors being rather high, which directly translates to time and time equals money.

As open-source projects go the available funding for OpenSimulator is minimal and there are not many providing financial support towards the project, especially as of late. Made worse by other adjacent projects taking funding from willing donors to stage events or run platforms with very little to no return to the project. While the project enjoys support rendered in different forms from the monetary aspect, there is only so much achieved through user contributions and anything major ultimately requires either a very driven individual or an organization providing funding without attaching unnecessary strings to it. Some “organizations” that did attempt to further the project have made a complete mess of their funding campaigns, which likely only serves to deter others. Leaves driven individuals electing to donate their free time towards the project and hopefully a community willing to show them appreciation in return, however form that may take.

We look into the future with a hopeful heart and plans to support both our customers and the OpenSimulator project to the best of our abilities. We hope you can spare some love for the project and show your appreciation in some way, if only by continuing to report bug or providing feedback. Again, shoutout to Microsoft for showing their ugly side again.

Patching vs. Merging

One of the biggest complications of software development across multiple people is keeping things in sync and making sure contributions don’t conflict with one another. The desire to solve this has spawned countless tools, development concepts and cycles along with a plethora of case studies by bored middle-management. The most common tools to help with keeping things in sync these days are git and svn, which provide versioning of code and tools to maintain code across multiple people and multiple development points. With git being the most widely used now a lot of projects have started to switch to it, the same was true for OpenSimulator years ago, moving from svn to git. Over the years the git ecosystem spawned a number of useful tools that certainly helped to move development of a lot of projects forward by making things easier to maintain and merge, but not every part of course.

Permissive open-source projects, such as OpenSimulator, provide the ability for anyone to create their own flavors, making changes they would like to see and adjusting their experience accordingly. Traditionally this is done by taking the existing code repository and making changes directly, subsequently being faced with the prospect of merging the changes made by the original author of a project back into theirs. While not a big deal for minor changes, the larger a project becomes the more difficult this task can be and it’s not fast or intuitive either. Like with most things surrounding git, there exist tools to help make the merging process easier and git itself is designed to try and merge code as best it can to leave on the most grave differences up for human review. However, therein also lies a potential for software, making assumptions about “correct” code, creating a complete mess. The more such a project, commonly referred to as a fork, diverges from the main project, the more complex such merge operations can be for both software and the human maintaining the fork.

This style of merging is the more prominent method most employ to maintain their forks of projects, but in the cases where merging the main code back into their projects ends up being a bigger task than the changes ever were to begin with another option might be less problematic and time-consuming. Git allows for any change to become a patch file, which contains just the change and instructions for git to merge the respective code into where it was changed. This, despite being tied to a specific file and position, can still take advantage of merging tools and operations, allowing a patch to be applied so long as the surrounding code matches. Meaning a patch created from a code change can be applied to many different versions of a project so long as there were no other changes to the same code. Obviously this makes maintaining changes in a rapid development environment a lot easier as there is no longer a need to merge every change and review for any mess that might have been caused. Patching in this manner isn’t free of problems, but the done changes compared to the patch itself is easier to review.

Applying such a patch stack to a project like OpenSimulator isn’t a solution without work involved as there are conflicts from time to time and changes elsewhere in the code can have an impact, especially when functions change or code standards require rewriting of existing patches. However, especially in regards to rapid development and testing both features and bugfixes in a manner not requiring large code merges and reviews has been vital to reducing the workload of maintaining a fork while still providing active feedback and development back to OpenSimulator. While traditional merging makes sense for projects that have slower development cycles or forks that only follow larger releases on bigger timescales, for anything that moves faster and needs changes to make it into the codebase in hours rather than days using patches usually remains the better way to go. Of course there is never an ideal solution when dealing both with code and humans in a mix trying to develop and maintain two separate, but connected and dependent, entities.

The flexibility of patching and the rapid development cycle of OpenSimulator, though, seem to be a better match than merging. Especially the flexibility to tailor OpenSimulator to the individual requirements of customers through leaving certain patches out or adding special ones in, while still being able to relatively easily stay up to date, has sold us on this approach. For less complex projects, like some of OpenSimulator’s dependencies, we still employ merging as well, given the changes are minor enough that merge conflicts are nearly impossible. Something as complex as OpenSimulator itself, however, other forks and projects have shown merging to only function in longer time frames as there is just too much code to review as development continues to progress on an almost daily commit schedule.